
Hitachi wants to tell your boss how happy you are. The latest privacy incursion - er, I mean big data initiative - to hit the workforce.

Strategic Workforce Planning, the Future of Work, and Workforce Analytics - Articles, Thoughts, and Updates
Viewing entries in
Workforce Analytics
Hitachi wants to tell your boss how happy you are. The latest privacy incursion - er, I mean big data initiative - to hit the workforce.
An employee's data is worth a happy meal on the black market, and $81.50 on LinkedIn. How much is it worth to your organisation?
Beechcraft 1900D Cockpit
I had the pleasure of travelling around the spectacular Bay of Plenty region in New Zealand last week, developing 2024 workforce strategy with some incredible people. The hop from Auckland to Rotorua was on a Beechcraft 1900D, and I was fortunate enough to be in 1F - the seat that gives you the best of the cockpit, which gave me pause for thought about workforce analytics dashboard design. Although I usually advocate for a "less is more" approach to analytics in dashboards, the dashboard of an aircraft is fascinating - every gauge, every dial serves a purpose and provides real-time, actionable data. Many business analytics dashboards don't exhibit these properties. A good rule of thumb when determining whether workforce analytics should be reported is to ask these three questions:
If you're unable to answer these three questions, it may be time to take your dashboard back to the drawing board.
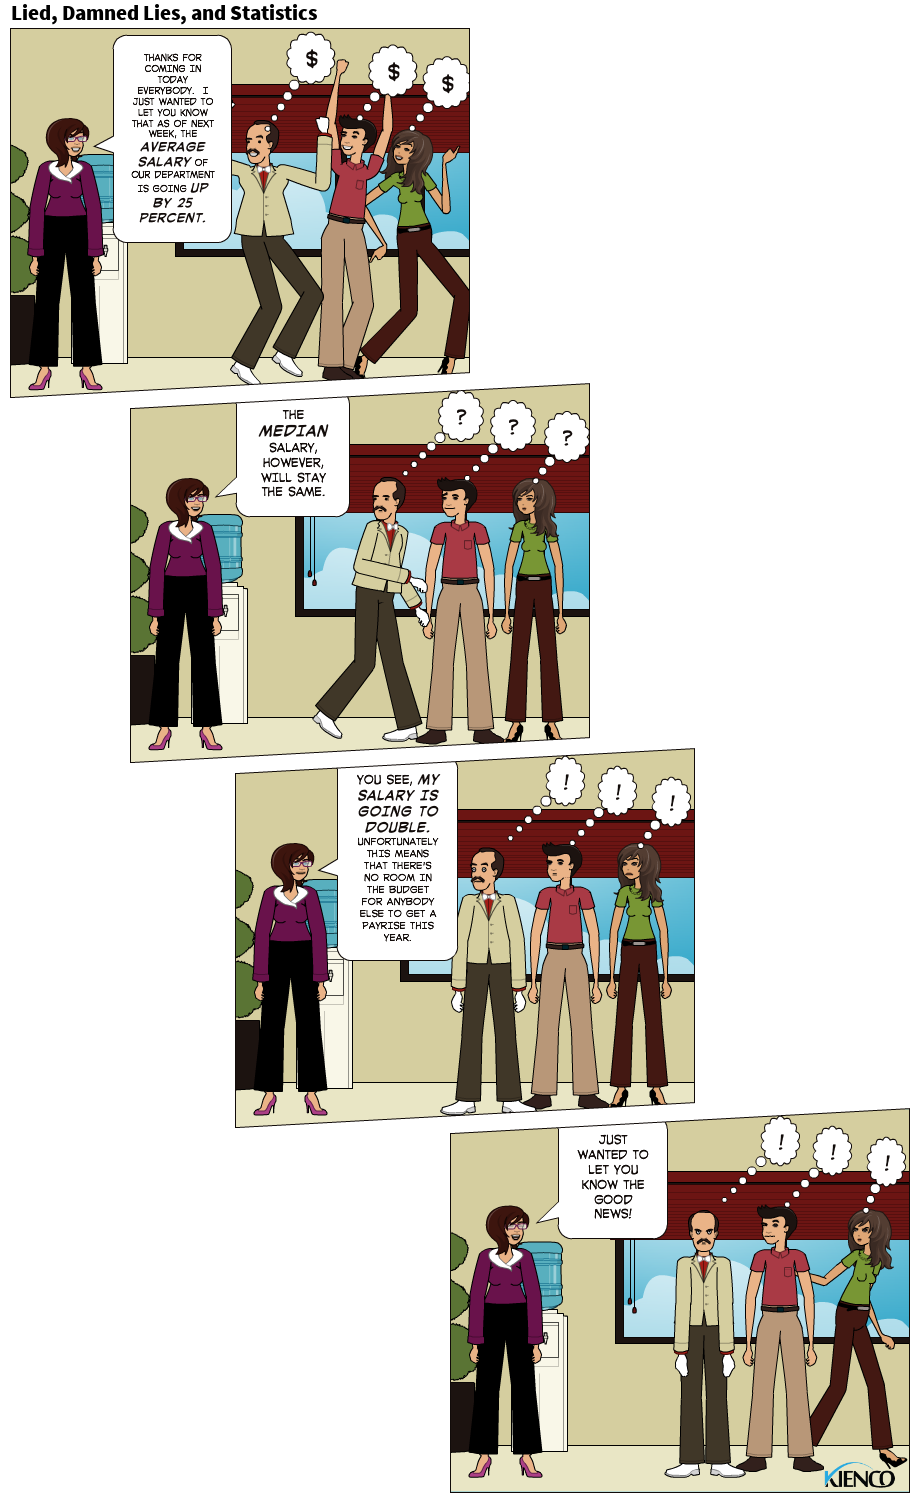
Recently on Quora, I was asked to answer a question about why organisations base pay on benchmarked Median salaries, rather than Averages. I thought I'd repeat that answer here, with the help of a comic strip.
There are three main statistical measures of central tendency, or what is "typical" - Mean (aka Average), Median, and Mode. There are also, according to Mark Twain, three kinds of lies - "Lies, Damned Lies, and Statistics".
Let's address the three measures of central tendency first:
Any list of values that has a logical lower limit and no logical upper limit should be reported as a Median, because a high value in the list will skew the results - and the measure is subject to fluctuations that no longer represent what is typical. If the CEO gets a payrise, the mean will increase, but the median won't change. A median, therefore, is a more typical measure of what's typical in this case.
Depending on your data, different measures can tell you a different story - and sometimes these stories are misleading. That's what happens when you report Salaries, Length of Service, or any other metric where there is a logical lower limit (usually zero) and no logical upper limit. In those cases, averages are - well, pretty average. This is also why House Prices use median: it's more representative of what's "typical", and less prone to wild fluctuations than the average.
Back in feudal Japan, ninjas were revered warriors whose functions included espionage, sabotage, infiltration, and assassination. Unfortunately, career prospects dried up for Ninjas in the 1600's due to the unification of Japan under the Tokugawa shogunate. Today, job prospects for Ninjas are slim.
The field is often referred to as “workforce planning and analytics”, but in fact, workforce planning and workforce analytics are two distinct, but related, fields. Often ‘workforce planning and analytics’ is the term applied to an approach that is analytics alone. While it’s true that analytics are critical to generating the insights for a strategic workforce plan, it is only one of several integrated steps that also includes ‘futuring’, environment scanning, and, most importantly, integration to business strategy.
Last week I had the honor of being invited to speak at the Melbourne HR Talent Community with Steve Pell of Intrascope Analytics. Steve and I discussed analytics for HR, why "Big Data" is all the rage, and why most of the valuable data about your workforce is already sitting inside your internal systems (Big Data or Small Data, it's all about the insights). The enclosed video is 8 minutes extracted from the 45+ minute conversation.
A picture can tell 1000 words. But sometimes it just says "huh?"