
The sequel to the international bestseller Humane, Resourced is called "This Time, its Personnel" and is now on sale for digital download on the Amazon.

Strategic Workforce Planning, the Future of Work, and Workforce Analytics - Articles, Thoughts, and Updates
The sequel to the international bestseller Humane, Resourced is called "This Time, its Personnel" and is now on sale for digital download on the Amazon.
Asimov died in 1992, 6 years before Google was created and 2 years before Yahoo!, Lycos, and Netscape were founded - but he still managed to predict MOOCs.
HR needs to equip themselves with the knowledge, methods, and frameworks that will allow them to be strategic - but organisations need to enable them to use these tools.
Recently Pew Research ran a survey on the impact of Artificial Intelligence and Robotics on the future of work. 1,896 experts responded to the survey, with 48% believing that automation and robotics will displace a significant number of workers by 2025. The 52% of techno-optimists nonetheless recognised that many current roles will be displaced, even if net employment is the same or higher than it is today.
Frey and Martin at Oxford, in their "The Future of Employment" study, suggested that 47% of current work could be automated in the next 10-20 years, and many of the roles forecast to be automated are jobs traditionally held by younger workers, or lower-skilled work. Some of the roles most likely to be automated, according to the study, are:
Imagine the "career ladder" with the first three rungs hacked off - that's the future we're heading into if these roles aren't replaced. How will we support people entering the workforce if there are no entry-level roles?
What was particularly interesting to me in the Pew Report was:
a. That the respondents were high-profile economists, futurists, journalists, and technologists representing organisations including the New York Times, Yahoo, Google, the Institute for the Future, the European Union, The Economist, and NASA - in other words, the people who are in a position to shape the future; and that
b. Many respondents assigned responsibility for guiding the adjustment to governments, educators, or luck. Some key responses are below:
“Governments will have to collaborate effectively with technology companies and academic institutions to provide massive retraining efforts over the next decade to prevent massive social disruption from these changes.”
“The notion of work as a necessity for life cannot be sustained if the great bulk of manufacturing and such moves to machines - but humans will adapt by finding new models of payment as they did in the industrial revolution (after much upheaval)”
“It seems inevitable to me that the proportion of the population that needs to engage in traditional full-time employment, in order to keep us fed, supplied, healthery, and safe, will decrease. I hope this leads to a humane restructuring fo the general social contract around employment.”
“...A technological advance by itself can be either positive or negative for jobs, depending on the social structure as a whole... this is not a technological consequence: rather it is a political choice”
“...It will require wrestling with ideologically fraught solutions, such as a guaranteed minimum income, and a broadening of our social sense of what is valuable work”
It's impossible to accurately predict the future, but it is possible to forecast multiple futures, and plan initiatives to respond to those scenario - even if we don't know precisely how the future will unfold. It's clear that whether you believe that net jobs will be destroyed through automation or not, there is a huge transition already happening, and the pace is accelerating. Reports like the Oxford and Pew papers are a wake-up call, but they're not a solution - and we all have a role in determining whether our future is utopian or dystopian.
What are some ways that you believe we can support people undergoing technological unemployment, particularly if the number of unemployed rises above historic levels? How do you see work looking in 2025? How do we support people entering the workforce, if robots and algorithms are doing all the entry-level roles?
Scenario planning is a critical way to anticipate and adapt to (and sometimes take advantage of) the profound changes being faced in the technology, consumer, and labor markets. Even where you are forced to respond to the external environment, you can still position yourself to be agile enough to respond quickly and effectively. Perhaps that's why this quote appeals to us so much!
Beechcraft 1900D Cockpit
I had the pleasure of travelling around the spectacular Bay of Plenty region in New Zealand last week, developing 2024 workforce strategy with some incredible people. The hop from Auckland to Rotorua was on a Beechcraft 1900D, and I was fortunate enough to be in 1F - the seat that gives you the best of the cockpit, which gave me pause for thought about workforce analytics dashboard design. Although I usually advocate for a "less is more" approach to analytics in dashboards, the dashboard of an aircraft is fascinating - every gauge, every dial serves a purpose and provides real-time, actionable data. Many business analytics dashboards don't exhibit these properties. A good rule of thumb when determining whether workforce analytics should be reported is to ask these three questions:
If you're unable to answer these three questions, it may be time to take your dashboard back to the drawing board.
Mars One is an initiative to create a human settlement on Mars, with the first crew expected to depart earth in 2024. Although I can't imagine applying to go on a one-way mission to Mars, I'm fascinated by the concept and intrigued by the process.
Needless to say, taking a job like this is no small commitment - you are literally giving your life to your job, and the first crew of four's commitment and preparation will determine the success of a program to colonise another planet. (No pressure).
What's particularly interesting to me is the selection criteria - although there are some age requirements and no doubt health requirements, the five key criteria are Resiliency, Adaptability, Curiosity, Ability to Trust, and Creativity / Resourcefulness. Technical skills can be taught, even on a scientific mission - but the right persona is critical. We see this playing out in all different industries, all round the world - what differentiates a competent member of the workforce from an exception performer is rarely a technical skill - but we typically source for and develop on technical skill alone.
Mars One Way from VITA BREVIS FILMS on Vimeo.
What are the competencies, skills, and personas that separate high performers from everyone else in your workforce? Knowing that, what are you doing to build HR initiatives to stack the deck towards high performance?
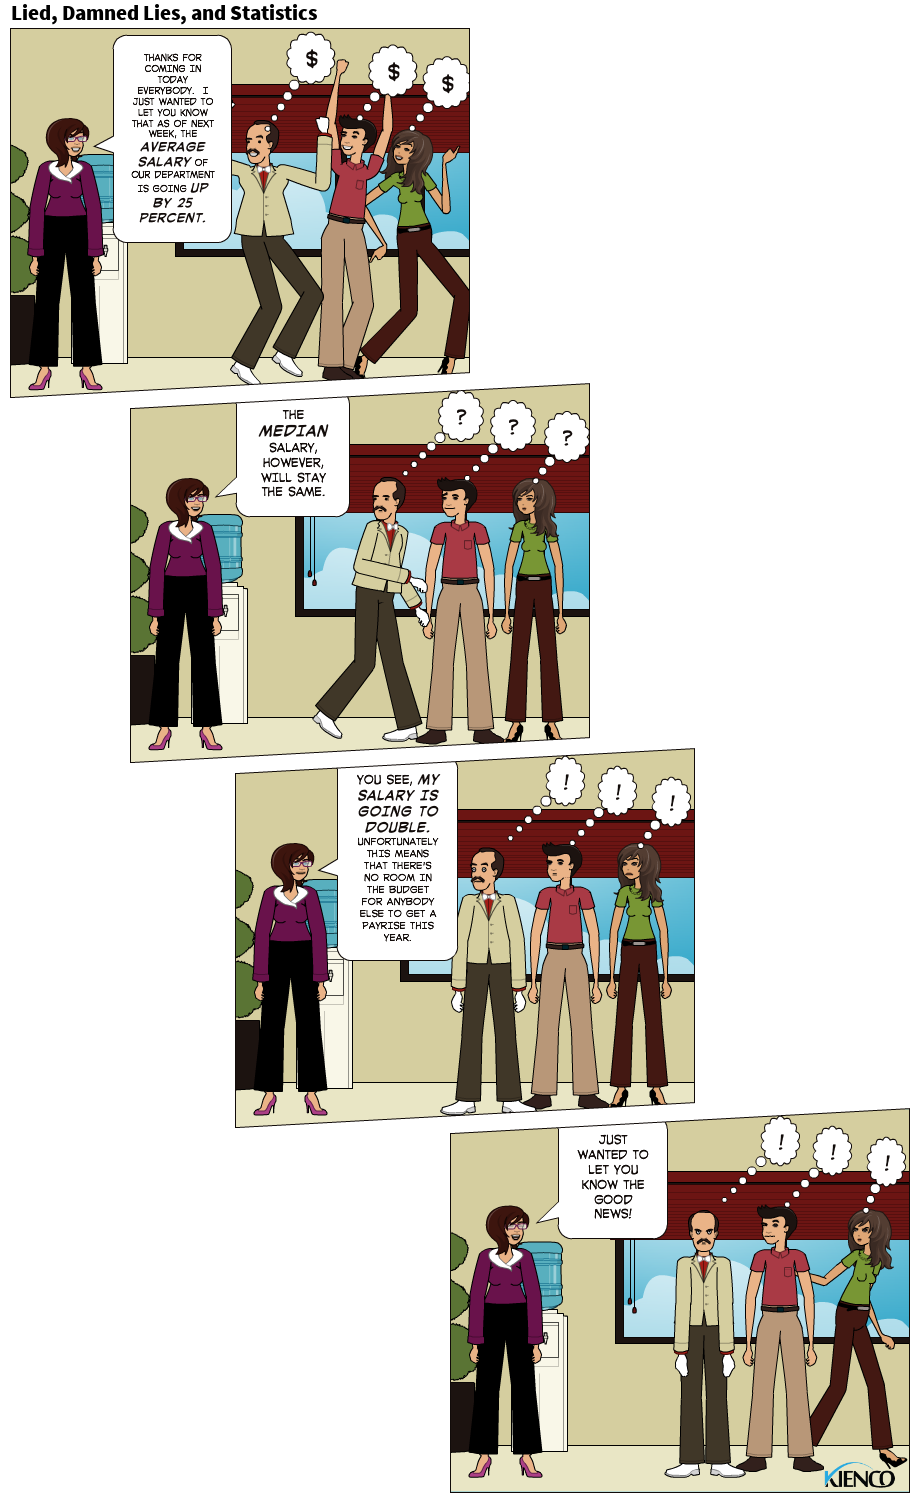
Recently on Quora, I was asked to answer a question about why organisations base pay on benchmarked Median salaries, rather than Averages. I thought I'd repeat that answer here, with the help of a comic strip.
There are three main statistical measures of central tendency, or what is "typical" - Mean (aka Average), Median, and Mode. There are also, according to Mark Twain, three kinds of lies - "Lies, Damned Lies, and Statistics".
Let's address the three measures of central tendency first:
Any list of values that has a logical lower limit and no logical upper limit should be reported as a Median, because a high value in the list will skew the results - and the measure is subject to fluctuations that no longer represent what is typical. If the CEO gets a payrise, the mean will increase, but the median won't change. A median, therefore, is a more typical measure of what's typical in this case.
Depending on your data, different measures can tell you a different story - and sometimes these stories are misleading. That's what happens when you report Salaries, Length of Service, or any other metric where there is a logical lower limit (usually zero) and no logical upper limit. In those cases, averages are - well, pretty average. This is also why House Prices use median: it's more representative of what's "typical", and less prone to wild fluctuations than the average.